Memory Allocation and Garbage Collection: How Programs Manage Memory
A deep dive into how programming languages allocate, track, and reclaim memory. Understand malloc internals, garbage collection algorithms, and the trade-offs that shape runtime performance.
Every program needs memory, and every byte eventually becomes garbage. Between allocation and collection lies a fascinating world of algorithms, data structures, and engineering trade-offs that profoundly affect application performance. Whether you’re debugging memory leaks, optimizing allocation patterns, or choosing between languages, understanding memory management internals gives you the mental models to make better decisions.
1. The Memory Landscape
Before diving into allocation strategies, let’s understand the terrain.
1.1 Virtual Address Space Layout
Typical Process Memory Layout (Linux x86-64):

┌─────────────────────────────────┐ 0x7FFFFFFFFFFF (high)
│           Stack                 │ ← Grows downward
│             ↓                   │
├─────────────────────────────────┤
│                                 │
│        Unmapped Region          │
│                                 │
├─────────────────────────────────┤
│             ↑                   │
│           Heap                  │ ← Grows upward
├─────────────────────────────────┤
│         BSS Segment             │ ← Uninitialized globals
├─────────────────────────────────┤
│        Data Segment             │ ← Initialized globals
├─────────────────────────────────┤
│        Text Segment             │ ← Program code (read-only)
└─────────────────────────────────┘ 0x400000 (low)
The stack and heap grow toward each other from opposite ends of the address space. The stack handles function call frames automatically, while the heap requires explicit management—either by the programmer or by a garbage collector.
1.2 Stack vs Heap Allocation
// Stack allocation - automatic, fast, limited
void stack_example() {
    int local = 42;           // 4 bytes on stack
    char buffer[1024];        // 1KB on stack
    struct Point p = {1, 2};  // sizeof(Point) on stack

    // All automatically freed when function returns
}

// Heap allocation - manual, flexible, slower
void heap_example() {
    int* ptr = malloc(sizeof(int));  // 4+ bytes on heap
    char* buf = malloc(1024);        // 1KB+ on heap

    // Must explicitly free
    free(ptr);
    free(buf);
    // Forgetting = memory leak
}
Stack allocation is essentially free—just moving a pointer. Heap allocation involves complex bookkeeping, potential system calls, and careful lifetime management.
1.3 The Allocation Problem
The fundamental challenge:

Given:
- Programs request memory in varying sizes
- Requests arrive in unpredictable order
- Memory is freed in unpredictable order
- Physical memory is limited

Goals:
- Fast allocation (minimize time per malloc)
- Fast deallocation (minimize time per free)
- Low fragmentation (maximize usable memory)
- Low overhead (minimize metadata per allocation)
- Good locality (related allocations near each other)

Trade-offs are unavoidable:
- Speed vs fragmentation
- Metadata overhead vs allocation flexibility
- Simplicity vs optimal memory usage
2. Manual Memory Management: malloc Internals
The C runtime’s malloc and free functions hide sophisticated algorithms.
2.1 Basic Heap Structure
Simple free list implementation:

Each block has a header:
┌──────────────────────────────────────┐
│  size (includes header) | in_use bit │  ← Header (8-16 bytes)
├──────────────────────────────────────┤
│                                      │
│           User Data                  │  ← What malloc returns
│                                      │
└──────────────────────────────────────┘

Free blocks are linked:

┌────────┐    ┌────────┐    ┌────────┐
│ Header │───►│ Header │───►│ Header │───► NULL
│  Free  │    │  Free  │    │  Free  │
│  256B  │    │  128B  │    │  512B  │
└────────┘    └────────┘    └────────┘
2.2 Allocation Strategies
First Fit:
- Walk the free list
- Return first block >= requested size
- Fast but causes fragmentation at list head

Best Fit:
- Walk entire free list
- Return smallest block >= requested size
- Less fragmentation but slower (O(n) search)

Worst Fit:
- Return largest available block
- Leaves larger remaining fragments
- Rarely used in practice

Next Fit:
- Like first fit, but resume search from last position
- Distributes fragmentation throughout heap
2.3 Splitting and Coalescing
// When a block is larger than needed, split it
void* malloc_with_split(size_t size) {
    Block* block = find_free_block(size);

    size_t remaining = block->size - size - HEADER_SIZE;
    if (remaining >= MIN_BLOCK_SIZE) {
        // Split: create new free block from remainder
        Block* new_block = (Block*)((char*)block + size + HEADER_SIZE);
        new_block->size = remaining;
        new_block->free = true;
        insert_free_list(new_block);

        block->size = size;
    }

    block->free = false;
    return block->data;
}

// When freeing, merge with adjacent free blocks
void free_with_coalesce(void* ptr) {
    Block* block = get_header(ptr);
    block->free = true;

    // Coalesce with next block if free
    Block* next = get_next_block(block);
    if (next && next->free) {
        block->size += next->size + HEADER_SIZE;
        remove_from_free_list(next);
    }

    // Coalesce with previous block if free
    Block* prev = get_prev_block(block);
    if (prev && prev->free) {
        prev->size += block->size + HEADER_SIZE;
        block = prev;  // prev absorbs current
    } else {
        insert_free_list(block);
    }
}
2.4 Boundary Tags
Problem: How do we find the previous block for coalescing?

Solution: Boundary tags - duplicate size at end of block

┌─────────────┬────────────────────────┬─────────────┐
│ Header: 256 │       User Data        │ Footer: 256 │
└─────────────┴────────────────────────┴─────────────┘
                                        ↑
                    Next block can read this to find previous

Trade-off:
- Extra 4-8 bytes per block
- O(1) coalescing with previous block
- Most modern allocators use this for free blocks only
3. Modern Allocator Designs
Production allocators use sophisticated techniques for performance.
3.1 Segregated Free Lists
Instead of one free list, maintain many by size class:

Size Class 0 (16 bytes):   ●──●──●──●──NULL
Size Class 1 (32 bytes):   ●──●──NULL
Size Class 2 (64 bytes):   ●──●──●──NULL
Size Class 3 (128 bytes):  ●──NULL
Size Class 4 (256 bytes):  ●──●──NULL
...
Size Class N (large):      ●──NULL

Benefits:
- O(1) allocation for small sizes
- No splitting needed for exact-fit classes
- Reduced fragmentation within size classes

Used by: glibc malloc, jemalloc, tcmalloc
3.2 Slab Allocation
For fixed-size objects (common in kernels and object pools):

Slab for 64-byte objects:
┌────┬────┬────┬────┬────┬────┬────┬────┐
│ Obj│ Obj│FREE│ Obj│FREE│FREE│ Obj│ Obj│
│  1 │  2 │    │  4 │    │    │  7 │  8 │
└────┴────┴────┴────┴────┴────┴────┴────┘
         ↓         ↓     ↓
      Free list: 3 ──► 5 ──► 6 ──► NULL

Benefits:
- Zero fragmentation for that object size
- O(1) allocation and deallocation
- Objects can be pre-initialized

Linux kernel uses slab allocators extensively:
- kmem_cache_create() for specific object types
- SLUB (default), SLAB, SLOB variants
3.3 Thread-Local Caches
Problem: malloc lock contention in multi-threaded programs

Solution: Per-thread caches (tcmalloc, jemalloc)

Thread 1 Cache        Thread 2 Cache        Central Heap
┌─────────────┐       ┌─────────────┐       ┌──────────────┐
│ 16B: ●●●●   │       │ 16B: ●●     │       │              │
│ 32B: ●●     │       │ 32B: ●●●●●  │       │   Spans of   │
│ 64B: ●●●    │       │ 64B: ●      │       │   Pages      │
└─────────────┘       └─────────────┘       │              │
     │                      │               └──────────────┘
     └──────────────────────┴───── Refill when empty
                                    Return when too full

Benefits:
- No locking for thread-local allocations
- Batch transfers amortize central heap access
- Significant speedup for allocation-heavy workloads
3.4 Arena Allocation
For request-scoped allocations (web servers, compilers):

Request starts:
┌────────────────────────────────────────────────┐
│                    Arena                        │
│  ┌────┐ ┌────┐ ┌────┐ ┌────────┐              │
│  │Obj1│ │Obj2│ │Obj3│ │  Obj4  │   Free →    │
│  └────┘ └────┘ └────┘ └────────┘              │
│  Bump pointer: ──────────────────────────►    │
└────────────────────────────────────────────────┘

Request ends:
reset(arena);  // One operation frees everything

Benefits:
- Allocation is just pointer increment (ultra-fast)
- No individual free() calls needed
- No fragmentation within arena lifetime
- Perfect for batch processing

Used by: Apache APR pools, Rust's bumpalo, game engines
4. Fragmentation Deep Dive
Memory fragmentation is the silent performance killer.
4.1 Types of Fragmentation
Internal Fragmentation:
Wasted space INSIDE allocated blocks

Request 20 bytes, allocator rounds to 32:
┌──────────────────────────────────┐
│ Header │    20 used   │ 12 waste │
└──────────────────────────────────┘

External Fragmentation:
Wasted space BETWEEN allocated blocks

Total free: 300 bytes, but largest contiguous: 100 bytes
┌────┐    ┌────┐    ┌────┐    ┌────┐
│USED│FREE│USED│FREE│USED│FREE│USED│
│ 50 │100 │ 50 │100 │ 50 │100 │ 50 │
└────┘    └────┘    └────┘    └────┘

Can't satisfy 200-byte request despite having 300 free!
4.2 Measuring Fragmentation
// Simple fragmentation metric
double fragmentation_ratio(Heap* heap) {
    size_t total_free = 0;
    size_t largest_free = 0;

    for (Block* b = heap->free_list; b; b = b->next) {
        total_free += b->size;
        if (b->size > largest_free) {
            largest_free = b->size;
        }
    }

    if (total_free == 0) return 0.0;

    // Ratio: 0 = no fragmentation, 1 = completely fragmented
    return 1.0 - ((double)largest_free / total_free);
}
4.3 Real-World Fragmentation Patterns
Long-running servers often see fragmentation grow:

Hour 0:   [████████████████████████████████] 0% fragmented
Hour 12:  [██░░██░░██████░░██░░████░░██░░██] 25% fragmented
Hour 48:  [█░█░░█░█░░█░░█░█░░█░█░░█░░█░█░░] 50% fragmented

Common causes:
1. Varying allocation sizes mixed together
2. Long-lived allocations interspersed with short-lived
3. Allocation patterns that prevent coalescing

Solutions:
- Segregated allocators reduce size-mixing
- Arena allocation for request-scoped data
- Periodic heap compaction (if supported)
- Restart services periodically (crude but effective)
5. Garbage Collection Fundamentals
Garbage collection automates memory reclamation.
5.1 The Reachability Problem
Which objects can be freed?

Root Set: Starting points for reachability
- Global variables
- Stack variables (local variables, parameters)
- CPU registers

    Root Set
       │
       ▼
    ┌─────┐     ┌─────┐     ┌─────┐
    │  A  │────►│  B  │────►│  C  │  ← All reachable
    └─────┘     └─────┘     └─────┘
                   │
                   ▼
                ┌─────┐     ┌─────┐
                │  D  │     │  E  │  ← D reachable, E is garbage
                └─────┘     └─────┘

An object is garbage if no chain of references leads to it from roots.
5.2 Reference Counting
Simplest GC: Count incoming references

Object creation: refcount = 1
Assignment (ptr = obj): obj.refcount++
Going out of scope: refcount--
When refcount == 0: object is garbage

┌─────────┐ refcount=2  ┌─────────┐ refcount=1
│    A    │◄────────────│    B    │
└─────────┘             └─────────┘
     │                       ▲
     │       refcount=1      │
     └──────►┌─────────┐─────┘
             │    C    │
             └─────────┘

Problem: Cycles!

┌─────────┐ refcount=1  ┌─────────┐ refcount=1
│    A    │────────────►│    B    │
└─────────┘◄────────────└─────────┘

Neither can be collected even if unreachable from roots!
5.3 Cycle Collection
# Python combines reference counting with cycle detection

# Immediate collection for acyclic garbage:
x = SomeObject()  # refcount = 1
x = None          # refcount = 0, immediately freed

# Periodic cycle detection for circular references:
class Node:
    def __init__(self):
        self.next = None

a = Node()
b = Node()
a.next = b  # b.refcount = 2
b.next = a  # a.refcount = 2
a = None    # a.refcount = 1 (still referenced by b)
b = None    # b.refcount = 1 (still referenced by a)

# gc.collect() will find and free the cycle
import gc
gc.collect()  # Runs cycle detector
6. Mark and Sweep Collection
The foundational tracing garbage collector.
6.1 Algorithm Overview
Phase 1: Mark
- Start from roots
- Recursively mark all reachable objects

Phase 2: Sweep
- Scan entire heap
- Free all unmarked objects
- Clear marks for next collection

Before Collection:
┌───┐ ┌───┐ ┌───┐ ┌───┐ ┌───┐ ┌───┐ ┌───┐ ┌───┐
│ A │ │ B │ │ C │ │ D │ │ E │ │ F │ │ G │ │ H │
└───┘ └───┘ └───┘ └───┘ └───┘ └───┘ └───┘ └───┘
  ↑           ↑           ↑
 root        root        root
  │           │           │
  └────►B     └────►D     └────►F────►G

After Mark Phase:
┌───┐ ┌───┐ ┌───┐ ┌───┐ ┌───┐ ┌───┐ ┌───┐ ┌───┐
│ A●│ │ B●│ │ C │ │ D●│ │ E●│ │ F●│ │ G●│ │ H │
└───┘ └───┘ └───┘ └───┘ └───┘ └───┘ └───┘ └───┘
  ●=marked

After Sweep Phase:
┌───┐ ┌───┐ ┌───┐ ┌───┐ ┌───┐ ┌───┐
│ A │ │ B │ │ D │ │ E │ │ F │ │ G │   C and H freed
└───┘ └───┘ └───┘ └───┘ └───┘ └───┘
6.2 Implementation Details
// Mark phase: recursive marking
void mark(Object* obj) {
    if (obj == NULL || obj->marked) return;

    obj->marked = true;

    // Recursively mark referenced objects
    for (int i = 0; i < obj->num_refs; i++) {
        mark(obj->refs[i]);
    }
}

void mark_from_roots() {
    // Mark from stack roots
    for (StackFrame* frame = current_frame; frame; frame = frame->prev) {
        for (int i = 0; i < frame->num_locals; i++) {
            mark(frame->locals[i]);
        }
    }

    // Mark from global roots
    for (int i = 0; i < num_globals; i++) {
        mark(globals[i]);
    }
}

// Sweep phase: reclaim unmarked objects
void sweep() {
    Object* prev = NULL;
    Object* curr = heap_start;

    while (curr != NULL) {
        if (!curr->marked) {
            // Garbage - free it
            if (prev) prev->next = curr->next;
            else heap_start = curr->next;

            Object* garbage = curr;
            curr = curr->next;
            free(garbage);
        } else {
            // Live - clear mark for next GC
            curr->marked = false;
            prev = curr;
            curr = curr->next;
        }
    }
}
6.3 Mark-Sweep Trade-offs
Advantages:
- Handles cycles naturally
- No overhead during normal execution (no refcount updates)
- Can collect arbitrary object graphs

Disadvantages:
- Stop-the-world pauses (must pause program during collection)
- Proportional to heap size (must scan everything)
- Fragmentation (doesn't compact, leaves holes)

Pause time estimation:
- Mark time ∝ live objects (reachable set)
- Sweep time ∝ heap size (total objects)
- Large heaps = long pauses
7. Copying and Compacting Collectors
Solutions to fragmentation from mark-sweep.
7.1 Semi-Space Copying Collection
Divide heap into two equal halves:

From-Space (active)          To-Space (empty)
┌─────────────────────┐     ┌─────────────────────┐
│ A B C D E F G H     │     │                     │
└─────────────────────┘     └─────────────────────┘

After collection (only A, B, D, F, G survive):

From-Space (now empty)       To-Space (now active)
┌─────────────────────┐     ┌─────────────────────┐
│                     │     │ A B D F G           │
└─────────────────────┘     └─────────────────────┘
                               ↑
                            Objects compacted!
7.2 Cheney’s Algorithm
// Elegant breadth-first copying collector
void collect() {
    char* scan = to_space;   // Next object to process
    char* free = to_space;   // Next free location

    // Copy roots to to-space
    for (each root r) {
        r = copy(r, &free);
    }

    // Process copied objects (breadth-first)
    while (scan < free) {
        Object* obj = (Object*)scan;

        // Update this object's references
        for (each reference ref in obj) {
            ref = copy(ref, &free);
        }

        scan += obj->size;
    }

    // Swap spaces
    swap(from_space, to_space);
}

Object* copy(Object* obj, char** free) {
    if (obj == NULL) return NULL;

    // Already copied? Return forwarding address
    if (obj->forwarding != NULL) {
        return obj->forwarding;
    }

    // Copy to to-space
    Object* new_obj = (Object*)*free;
    memcpy(new_obj, obj, obj->size);
    *free += obj->size;

    // Leave forwarding pointer
    obj->forwarding = new_obj;

    return new_obj;
}
7.3 Compaction Trade-offs
Copying collector advantages:
- Compaction eliminates fragmentation
- Allocation is trivial (bump pointer)
- Only touches live objects (good for mostly-garbage heaps)

Copying collector disadvantages:
- Requires 2x memory (only half usable at once)
- Copies all live data every collection
- Bad for mostly-live heaps (copies everything)

Mark-Compact alternative:
- Mark live objects in place
- Compute new addresses
- Update all pointers
- Slide objects down
- Avoids 2x memory requirement but more complex
8. Generational Garbage Collection
The most important optimization in modern GC.
8.1 The Generational Hypothesis
Empirical observation about program behavior:

"Most objects die young"

Object Lifetime Distribution:
│
│ ████
│ ████
│ ████
│ ████ ██
│ ████ ██ █
│ ████ ██ █ █               ▁ ▁
└─────────────────────────────────►
  Young    ← Age →           Old

Implications:
- Frequently collecting young objects yields most garbage
- Old objects rarely become garbage
- Don't waste time scanning old objects repeatedly
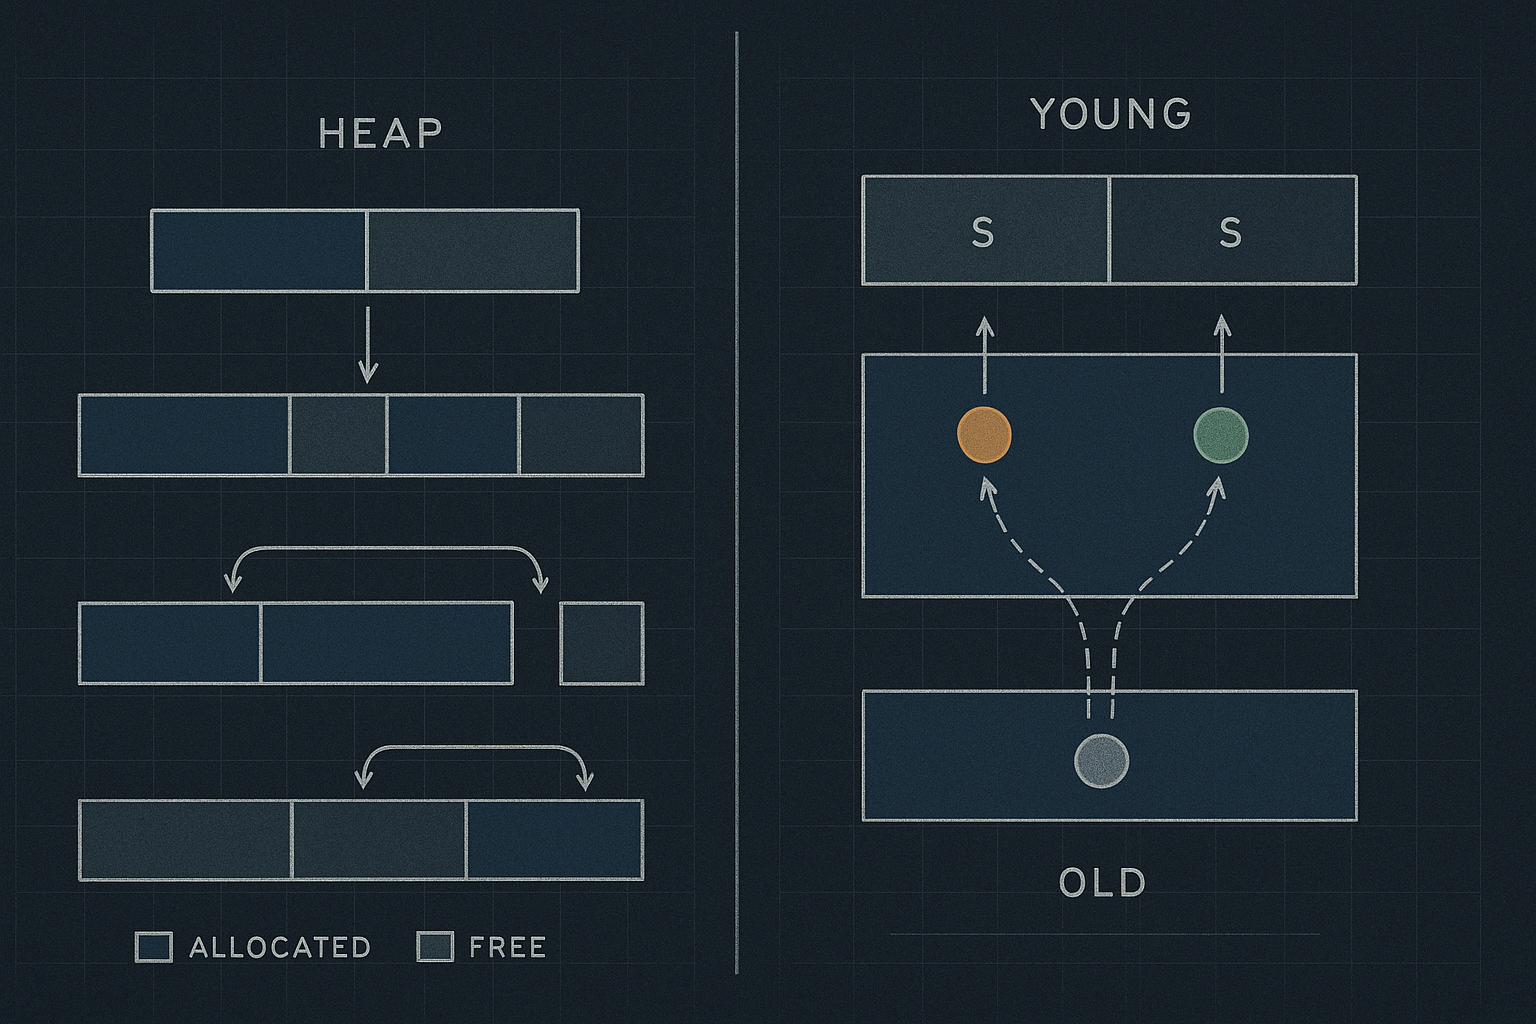
8.2 Generational Heap Structure
Typical two-generation layout:

Young Generation (collected frequently)
┌──────────────────────────────────────────┐
│  Eden          │ Survivor 0 │ Survivor 1 │
│  (new allocs)  │    (S0)    │    (S1)    │
└──────────────────────────────────────────┘
                        │
                   Promotion after N survivals
                        ↓
Old Generation (collected infrequently)
┌──────────────────────────────────────────┐
│                                          │
│         Long-lived objects               │
│                                          │
└──────────────────────────────────────────┘

Collection frequency:
- Minor GC (young only): Hundreds per second possible
- Major GC (full heap): Seconds to minutes apart
8.3 Write Barriers
Problem: Old objects can reference young objects

    Old Generation        Young Generation
    ┌─────────────┐       ┌─────────────┐
    │     A ──────┼──────►│      B      │
    └─────────────┘       └─────────────┘
                                ↑
    If we only scan young gen, we'd miss this reference!

Solution: Write barrier tracks cross-generation pointers

void write_barrier(Object* old, Object* young) {
    if (is_old(old) && is_young(young)) {
        // Remember this old object has young reference
        add_to_remembered_set(old);
    }
}

// Minor GC roots = stack + remembered set
// The write barrier has runtime cost but enables generational GC
8.4 Survivor Spaces and Aging
Minor GC process:

1. Allocate in Eden until full
   Eden: [AAAAaaaBBBbbbCCCccc...FULL]

2. Minor GC: Copy live objects to S0
   Eden: [empty]
   S0: [A B C] (survivors, age=1)

3. More allocation in Eden
   Eden: [DDDdddEEEeee...FULL]
   S0: [A B C]

4. Minor GC: Copy Eden+S0 live to S1
   Eden: [empty]
   S0: [empty]
   S1: [A B D E] (A,B age=2; D,E age=1)

5. After N survivals, promote to Old Gen
   Age threshold typically 15 (configurable)
   Old: [A B] (promoted after 15 minor GCs)
9. Concurrent and Incremental Collection
Reducing pause times for interactive applications.
9.1 The Pause Problem
Stop-the-world collection:

Thread 1: ████████░░░░░░░░████████
Thread 2: ████████░░░░░░░░████████
Thread 3: ████████░░░░░░░░████████
                 ↑       ↑
              GC Start  GC End

              100ms pause = unacceptable for:
              - Real-time games (16ms frame budget)
              - Trading systems (microsecond latency)
              - Interactive UIs (user perceives >100ms)
9.2 Incremental Collection
Break GC work into small chunks:

Traditional:    [──────────────GC──────────────]

Incremental:    [─GC─][─app─][─GC─][─app─][─GC─][─app─][─GC─]

Each GC slice does a little work:
- Mark a few objects
- Process one generation
- Update some pointers

Pause time per slice: 1-10ms instead of 100ms+
Total GC time may increase (more context switches)
9.3 Concurrent Marking
Run marking phase concurrently with application:

Time ──────────────────────────────────────────►

Mutator:   ████████████████████████████████████
                ↑             ↑            ↑
GC Marker: ░░░░████████████████████████░░░░░░░
               Start         End       Remark
               mark          mark      (STW)

Challenge: Application modifies object graph during marking

Tri-color marking:
- White: Not yet seen (potential garbage)
- Gray:  Seen, but references not yet scanned
- Black: Scanned, all references traced

Invariant: Black objects never point to white objects
           (enforced by write barriers)
9.4 Tri-Color Abstraction
Initial state (all white):
○ ○ ○ ○ ○ ○ ○ ○

Mark roots gray:
● ○ ○ ○ ○ ○ ○ ○  (● = gray)

Process gray objects (mark references gray, self becomes black):
◆ ● ● ○ ○ ○ ○ ○  (◆ = black)

Continue until no gray objects:
◆ ◆ ◆ ◆ ● ○ ○ ○
◆ ◆ ◆ ◆ ◆ ○ ○ ○  ← All white objects are garbage

Write barrier during concurrent mark:
If black object gets reference to white object:
  - Either gray the white object (snapshot-at-beginning)
  - Or gray the black object (incremental update)
10. Real-World GC Implementations
Different language runtimes make different trade-offs.
10.1 JVM Garbage Collectors
G1 (Garbage First) - Default since JDK 9:
┌────┬────┬────┬────┬────┬────┬────┬────┐
│Eden│Eden│Surv│Old │Old │ H  │Free│Free│
└────┴────┴────┴────┴────┴────┴────┴────┘
     Regions (~1-32MB each)     H=Humongous

- Heap divided into ~2000 regions
- Collects regions with most garbage first
- Target pause time (default 200ms)
- Concurrent marking, parallel collection

ZGC (Z Garbage Collector) - JDK 15+:
- Sub-millisecond pauses (<1ms target)
- Concurrent relocation using colored pointers
- Handles multi-terabyte heaps
- Load barriers instead of write barriers

Shenandoah:
- Similar goals to ZGC
- Concurrent compaction
- Brooks forwarding pointers
10.2 Go’s Garbage Collector
Go GC: Concurrent, tri-color, mark-sweep

Design priorities:
1. Low latency (sub-millisecond pauses)
2. Simplicity (no generational complexity)
3. Predictability (consistent pause times)

GC Phases:
1. Mark Setup (STW, very brief)
2. Concurrent Mark (runs with application)
3. Mark Termination (STW, very brief)
4. Concurrent Sweep (runs with application)

Tuning via GOGC:
GOGC=100 (default): Collect when heap doubles
GOGC=50: Collect when heap grows 50%
GOGC=200: Collect when heap triples
GOGC=off: Disable GC entirely
10.3 Python’s Memory Management
# Python: Reference counting + generational cycle collector

import sys
import gc

x = []
print(sys.getrefcount(x))  # 2 (x + getrefcount arg)

y = x
print(sys.getrefcount(x))  # 3

del y
print(sys.getrefcount(x))  # 2

# Cycle collector for circular references
gc.get_threshold()  # (700, 10, 10)
# Gen 0 collected every 700 allocations
# Gen 1 collected every 10 Gen 0 collections
# Gen 2 collected every 10 Gen 1 collections

# Manual control
gc.disable()        # Disable automatic collection
gc.collect()        # Force full collection
gc.set_threshold(1000, 15, 15)  # Adjust thresholds
10.4 Rust’s Ownership Model
// Rust: No GC needed - ownership and borrowing

fn main() {
    let s1 = String::from("hello");  // s1 owns the string

    let s2 = s1;  // Ownership moves to s2
    // println!("{}", s1);  // Error! s1 no longer valid

    let s3 = s2.clone();  // Explicit copy
    println!("{} {}", s2, s3);  // Both valid

}  // s2 and s3 dropped here, memory freed

// Borrowing for temporary access
fn print_length(s: &String) {  // Borrows, doesn't own
    println!("Length: {}", s.len());
}  // s goes out of scope, but doesn't drop the string

// Lifetimes ensure references are valid
fn longest<'a>(x: &'a str, y: &'a str) -> &'a str {
    if x.len() > y.len() { x } else { y }
}
11. Escape Analysis and Stack Allocation
Compiler optimizations can avoid heap allocation entirely.
11.1 What is Escape Analysis?
// Java: JIT compiler analyzes if objects "escape"

public int sumPoints() {
    // This Point doesn't escape the method
    Point p = new Point(3, 4);  // Could be stack allocated
    return p.x + p.y;
}

public Point createPoint() {
    // This Point escapes - returned to caller
    return new Point(3, 4);  // Must be heap allocated
}

public void storePoint(List<Point> list) {
    Point p = new Point(3, 4);
    list.add(p);  // Escapes into list - heap allocated
}
11.2 Escape Analysis Benefits
When objects don't escape:

1. Stack Allocation
   - No GC overhead
   - Automatic deallocation
   - Better cache locality

2. Scalar Replacement
   // Instead of:
   Point p = new Point(3, 4);
   return p.x + p.y;

   // Compiler generates:
   int p_x = 3;
   int p_y = 4;
   return p_x + p_y;

   // No object created at all!

3. Lock Elision
   // If object doesn't escape:
   synchronized(localObject) { ... }
   // Lock can be eliminated entirely
11.3 Go’s Escape Analysis
// Go makes escape analysis visible

package main

func main() {
    x := createLocal()   // x allocated on stack
    y := createEscaping() // *y allocated on heap

    _ = x
    _ = y
}

func createLocal() int {
    n := 42
    return n  // int copied, n doesn't escape
}

func createEscaping() *int {
    n := 42
    return &n  // Address escapes! n moved to heap
}

// Build with: go build -gcflags="-m" main.go
// Output:
//   ./main.go:13:2: moved to heap: n
//   ./main.go:8:2: n does not escape
12. Memory Pools and Object Recycling
Application-level memory management patterns.
12.1 Object Pools
// sync.Pool in Go - amortize allocation cost

var bufferPool = sync.Pool{
    New: func() interface{} {
        return make([]byte, 4096)
    },
}

func processRequest(data []byte) {
    // Get buffer from pool (or create new)
    buf := bufferPool.Get().([]byte)

    // Use buffer
    copy(buf, data)
    process(buf)

    // Return to pool for reuse
    bufferPool.Put(buf)
}

// Benefits:
// - Reduces allocation pressure
// - Reduces GC work
// - Improves throughput for allocation-heavy workloads
12.2 Free Lists in Application Code
// Custom free list for game entities

#define MAX_ENTITIES 10000

typedef struct Entity {
    int id;
    float x, y, z;
    struct Entity* next_free;  // Union with game data in real code
} Entity;

Entity entities[MAX_ENTITIES];
Entity* free_list = NULL;

void init_entity_pool() {
    for (int i = 0; i < MAX_ENTITIES - 1; i++) {
        entities[i].next_free = &entities[i + 1];
    }
    entities[MAX_ENTITIES - 1].next_free = NULL;
    free_list = &entities[0];
}

Entity* alloc_entity() {
    if (free_list == NULL) return NULL;

    Entity* e = free_list;
    free_list = e->next_free;
    return e;
}

void free_entity(Entity* e) {
    e->next_free = free_list;
    free_list = e;
}
12.3 Arena Patterns in Practice
// Rust's bumpalo arena allocator

use bumpalo::Bump;

fn process_request() {
    // Create arena for this request
    let arena = Bump::new();

    // All allocations from arena
    let name = arena.alloc_str("hello");
    let numbers = arena.alloc_slice_copy(&[1, 2, 3, 4, 5]);
    let obj = arena.alloc(MyStruct::new());

    // Use allocated data...
    process(name, numbers, obj);

    // Arena dropped here - all memory freed at once
    // No individual destructors, no fragmentation
}
13. Debugging Memory Issues
Practical techniques for memory problems.
13.1 Memory Leak Detection
// Valgrind for C/C++
// $ valgrind --leak-check=full ./myprogram

==12345== LEAK SUMMARY:
==12345==    definitely lost: 1,024 bytes in 2 blocks
==12345==    indirectly lost: 0 bytes in 0 blocks
==12345==    possibly lost: 512 bytes in 1 blocks
==12345==    still reachable: 2,048 bytes in 4 blocks

// AddressSanitizer (faster, less complete)
// $ clang -fsanitize=address -g myprogram.c

// Common leak patterns:
// 1. Forgetting to free
char* leak1() {
    return malloc(100);  // Caller must free
}

// 2. Losing last reference
void leak2() {
    char* p = malloc(100);
    p = malloc(200);  // Original 100 bytes leaked
    free(p);
}

// 3. Exception paths
void leak3() {
    char* p = malloc(100);
    if (error_condition()) {
        return;  // Leaked!
    }
    free(p);
}
13.2 GC Tuning and Monitoring
// JVM GC logging
// -Xlog:gc*:file=gc.log:time,uptime:filecount=5,filesize=10m

// Example output:
[0.150s][info][gc] GC(0) Pause Young (Normal) (G1 Evacuation Pause) 24M->8M(256M) 5.123ms
[0.350s][info][gc] GC(1) Pause Young (Normal) (G1 Evacuation Pause) 32M->12M(256M) 4.567ms
[2.100s][info][gc] GC(2) Pause Young (Concurrent Start) (G1 Humongous Allocation) 128M->64M(256M) 8.901ms
[2.500s][info][gc] GC(2) Concurrent Mark completed 400.123ms

// Key metrics to monitor:
// - Pause times (aim for <200ms for most apps)
// - GC frequency (too often = heap too small)
// - Heap occupancy after GC (growing = potential leak)
// - Promotion rate (high = objects living too long)
13.3 Heap Dumps and Profiling
# Python memory profiling

# tracemalloc for allocation tracking
import tracemalloc

tracemalloc.start()

# Your code here
data = [list(range(1000)) for _ in range(1000)]

snapshot = tracemalloc.take_snapshot()
top_stats = snapshot.statistics('lineno')

for stat in top_stats[:10]:
    print(stat)

# Output:
# <filename>:5: size=7.6 MiB, count=1001, average=7.8 KiB

# memory_profiler for line-by-line analysis
# @profile decorator + python -m memory_profiler script.py

# objgraph for object graphs
import objgraph
objgraph.show_most_common_types(limit=10)
objgraph.show_backrefs(some_object, max_depth=3)
14. Performance Implications
Memory management directly affects application performance.
14.1 Allocation Cost Comparison
Allocation costs (approximate, varies by platform):

Stack allocation:     ~1 CPU cycle (just move pointer)
Thread-local cache:   ~20-50 cycles (tcmalloc/jemalloc fast path)
General malloc:       ~100-500 cycles (may involve locks)
System call (mmap):   ~10,000+ cycles (kernel involvement)
GC allocation:        ~10-100 cycles (bump pointer + barrier)

Takeaways:
- Prefer stack allocation when possible
- Pool frequently allocated objects
- Batch allocations to amortize overhead
- Profile before optimizing!
14.2 GC Pause Impact
GC pause effects on latency distribution:

Without GC optimization:
p50: 2ms    p99: 15ms    p99.9: 250ms ← GC pauses!

With GC tuning:
p50: 2ms    p99: 12ms    p99.9: 50ms

With concurrent GC:
p50: 2.5ms  p99: 10ms    p99.9: 20ms
                         ↑
             Slightly higher median, but consistent

Strategies:
- Tune heap size (larger = less frequent GC, longer pauses)
- Use concurrent/incremental collectors
- Reduce allocation rate
- Use off-heap storage for large data
14.3 Cache Effects of Allocation
Memory layout affects cache performance:

Sequential allocation (arena, bump allocator):
┌─────┬─────┬─────┬─────┬─────┐
│  A  │  B  │  C  │  D  │  E  │  ← Contiguous, cache-friendly
└─────┴─────┴─────┴─────┴─────┘

Fragmented heap after churn:
┌─────┐ ┌─────┐ ┌─────┐ ┌─────┐ ┌─────┐
│  A  │ │░░░░░│ │  C  │ │░░░░░│ │  E  │  ← Scattered
└─────┘ └─────┘ └─────┘ └─────┘ └─────┘

Processing all items:
- Contiguous: 1 cache miss, then hits
- Fragmented: Potential miss per item

For data-intensive work:
- Use arrays of values, not arrays of pointers
- Allocate related objects together
- Consider data-oriented design patterns
15. Language Design Trade-offs
How languages balance memory management concerns.
15.1 Manual vs Automatic Management
Manual (C, C++):
+ Maximum control and performance
+ Predictable timing (no GC pauses)
+ No runtime overhead
- Bugs: leaks, use-after-free, double-free
- Developer burden
- Security vulnerabilities

Reference Counting (Swift, Python, some C++):
+ Deterministic destruction
+ Simple mental model
+ Interop with manual code
- Can't handle cycles automatically
- Write overhead for refcount updates
- Thread safety concerns

Tracing GC (Java, Go, JavaScript):
+ Handles cycles
+ No write overhead (except barriers)
+ Less developer burden
- Unpredictable pauses
- Memory overhead (larger heaps)
- Less control over timing

Ownership (Rust):
+ No runtime overhead
+ Memory safety guaranteed
+ No GC pauses
- Steep learning curve
- Some patterns are awkward
- Longer compile times
15.2 Hybrid Approaches
Real-world systems often combine approaches:

Python: Reference counting + cycle collector
- Fast for simple cases
- Periodic cycle collection for complex graphs

C++ with smart pointers:
- unique_ptr: Single ownership, no overhead
- shared_ptr: Reference counting
- weak_ptr: Breaks cycles in shared_ptr graphs
- Manual for performance-critical paths

Swift: ARC with unowned/weak references
- Compiler inserts refcount operations
- Developer marks references to break cycles
- No GC pauses, but write overhead

Games often use:
- Arena per frame (bulk free)
- Object pools for entities
- Custom allocators per subsystem
- Minimal GC language usage
16. Emerging Trends and Research
The future of memory management.
16.1 Hardware Support
Non-Volatile Memory (NVM):
- Persistent heaps surviving power loss
- Changes allocation/GC assumptions
- Pointer swizzling for persistent graphs

Memory tagging (ARM MTE, Intel MPX):
- Hardware tracks pointer bounds
- Catch buffer overflows in hardware
- Some GC verification possible

Coherent accelerators:
- GPU/FPGA with shared memory
- Unified address spaces
- New challenges for GC (GPU references)
16.2 Low-Latency Techniques
Region-based memory (research):
- Infer lifetimes statically
- Allocate in regions that die together
- Minimize runtime overhead

Pauseless GC:
- ZGC, Shenandoah pushing boundaries
- Concurrent everything
- Sub-millisecond pauses at scale

Epoch-based reclamation:
- Track "epochs" when references observed
- Safe to free when epoch passes
- Used in lock-free data structures
16.3 Specialized Allocators
Memory-safe languages pushing boundaries:

mimalloc (Microsoft):
- Designed for memory-safe languages
- Free list sharding per page
- Excellent performance characteristics

Mesh (research):
- Compacts without moving objects
- Uses virtual memory to shuffle physical pages
- Compatible with unmodified programs

scudo (hardened allocator):
- Designed for security
- Randomization, guard pages
- Performance-security trade-off
17. Practical Recommendations
Guidance for different scenarios.
17.1 Choosing the Right Strategy
Embedded/Real-time:
- Static allocation where possible
- Memory pools for dynamic needs
- Avoid GC languages or disable GC

High-throughput services:
- Profile allocation patterns
- Use object pools for hot paths
- Tune GC for throughput
- Consider arena patterns

Low-latency trading:
- Pre-allocate everything
- Object pools, not allocation
- Off-heap for large data
- GC pauses are not acceptable

General applications:
- Trust your GC (usually)
- Profile before optimizing
- Fix leaks promptly
- Understand your language's model
17.2 Common Anti-Patterns
1. Premature optimization
   DON'T: Obsess over allocation without profiling
   DO: Measure first, optimize hot paths

2. Ignoring the allocator
   DON'T: Assume all allocations are equal
   DO: Understand your allocator's characteristics

3. Fighting the GC
   DON'T: Manually null references to "help" GC
   DO: Trust the GC, reduce allocation rate if needed

4. Memory leaks
   DON'T: Assume GC prevents all leaks
   DO: Watch for logical leaks (held references)

5. Wrong abstraction level
   DON'T: Always use lowest-level allocation
   DO: Match abstraction to problem (pools, arenas, GC)
Memory allocation and garbage collection represent one of computing’s most elegant trade-off spaces. From manual management offering maximum control to sophisticated concurrent collectors minimizing pause times, each approach serves different needs. Understanding these systems deeply helps you write more efficient code, debug memory issues effectively, and choose appropriate strategies for your specific requirements. The best memory management strategy depends on your latency requirements, throughput needs, developer productivity goals, and the specific characteristics of your workload.