Speculative Prefetchers: Designing Memory Systems That Read the Future
A field guide to building and validating speculative memory prefetchers that anticipate demand in modern CPUs and data platforms.
At 2:17 a.m., the on-call performance engineer watches another alert crawl across the dashboard. The new machine image promised higher throughput for a latency-sensitive analytics service, yet caches still thrash whenever end-of-day reconciliation jobs arrive. Each job walks a sparsely linked graph of customer transactions, and the CPU spends more time waiting on memory than executing instructions. “If only the hardware could guess where the program was going next,” she sighs. That daydream is the seed of speculative prefetching—the art of reading tomorrow’s memory today.
Speculative prefetchers look like magic from the outside: the processor issues a request for data that no instruction has formally demanded yet, betting that by the time the demand arrives the data will already sit in a warm cache. The trick lies in knowing which guesses are worth the risk. Guess wrong and you flood scarce bandwidth or evict useful cache lines. Guess right consistently and you turn an I/O-bound workload into a compute-bound one. This essay demystifies how modern engineers design, verify, and monitor speculative prefetchers, bridging microarchitectural realities with the needs of large-scale software systems.
1. Why speculation exists at all
Memory hierarchies grew deeper faster than processors slowed down. By the late 2010s, a core could execute multiple instructions per cycle, yet a cache miss to DRAM cost hundreds of cycles. Hiding that latency required going beyond simply caching the past; designers needed to predict the near future. Speculative prefetching lets hardware overlap memory fetch with current computation. If the future request follows a predictable pattern—strides through arrays, loops over tree levels, pointer-chasing in linked structures—the prefetcher can issue demand before the core stalls.
Speculation therefore exists because time matters. Without it, every cache miss is a full stop. With it, cores stretch their legs while the memory subsystem races ahead. The cost of speculation is risk: wasted bandwidth, pollution of shared caches, and energy consumption from unnecessary transfers. Balancing those risks against the upside is the central design challenge.
2. A taxonomy of prefetchable workloads
Engineers bucket workloads by the predictability of their memory access streams. Streaming analytics, video codecs, and dense matrix multiplies exhibit regular strides and are easy to predict. Graph analytics, B-trees under mixed read/write load, and garbage-collected runtimes produce chaotic pointer-chasing, challenging classic algorithms. Modern prefetchers therefore include multiple engines tuned to different signatures. One monitors fixed strides, another detects nested loops, a third traces correlation between instruction sequences and addresses, and a fourth learns pointer chains.
Understanding workload diversity shapes hardware firmware and software hints. In a multi-tenant cloud, a hypervisor may switch tenants with wildly different footprints, so prefetchers must re-learn patterns quickly. Conversely, embedded systems running a fixed workload can trade flexibility for specialization, embedding neural predictors that understand the application’s unique phases.
3. Anatomy of a speculative prefetcher
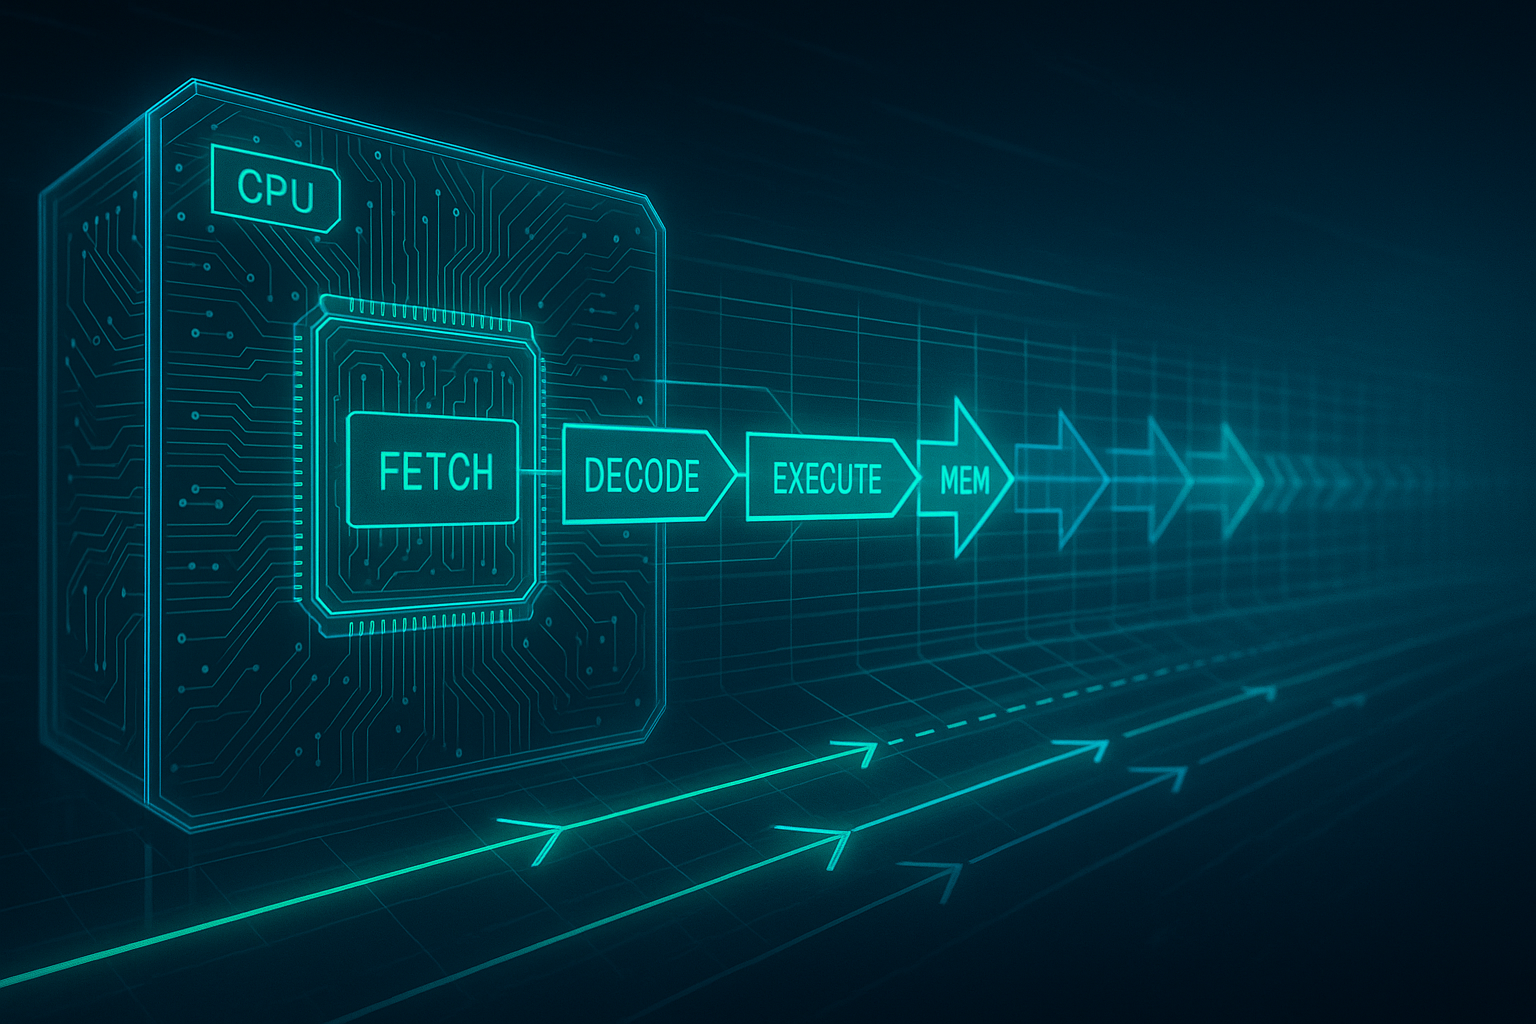
A prefetcher begins with monitors: small tables that watch streams of recent addresses, deltas, and program counters. When a monitor detects a pattern—say, four consecutive accesses with stride +64 bytes—it pushes a prediction into a queue. The core’s front-end tags each load with its program counter, letting the prefetcher correlate instruction fingerprints with observed addresses. Controllers arbitrate between multiple monitors, throttle requests, and enforce limits per core to avoid saturating the interconnect. A scoreboard tracks outstanding speculative loads to prevent redundant work.
Critically, the prefetcher sits near the memory controller or L2 cache. When a prediction fires, the hardware generates a memory request and marks the cache line as prefetched. If the CPU later touches that line, the transaction counts as a hit and increments the success counters. If the line ages out unused, the system records a negative event. Designers then tune thresholds—require two confirmations before a prediction becomes active, limit depth to four lookahead lines, or throttle when waste exceeds a budget.
4. From heuristics to math: modeling speculation
Early prefetchers used heuristic thresholds picked by intuition. Contemporary teams model speculation as a stochastic control problem. Let p be the probability a predicted line is used before eviction, c the cost of a wasted fetch in cycles, and g the gain of a hit. Prefetch if p·g − (1 − p)·c > 0. Estimating p is hard, so engineers approximate it using online statistics: counters of hits and misses per pattern, decayed over time to adapt to phase changes. Controllers convert those statistics into throttle levels, effectively turning hardware into a tiny reinforcement learner.
Designers also analyze queuing effects. Speculative requests fight with demand loads for bandwidth. Without guardrails, prefetching can increase queuing latency for real work. Queueing theory supplies approximate models—M/M/1 with priority queues—to set maximum in-flight prefetches. Some systems assign prefetch traffic a lower priority so demand loads preempt them. Others use credit-based schemes where prefetchers must “earn” credits by delivering hits.
5. Stories from the lab: when speculation backfires
During validation of a database accelerator, engineers enabled an aggressive correlation prefetcher that linked instruction sequences to future addresses. It shined on OLAP benchmarks but tanked OLTP workloads by polluting caches with speculation that never matured. Investigating traces revealed workload-dependent stride signatures: the optimizer would restructure queries, changing the access pattern every few milliseconds. The fix combined two ideas: a phase detector capturing query boundaries (resetting predictors), and a software hint API letting the database flag tables likely to benefit from speculation. With those changes, hit rates recovered without regressing stable workloads.
Another story centers on security. Spectre and Meltdown taught the community that speculative execution can leak secrets. Prefetchers, too, can serve as side channels. An attacker measuring cache occupancy may infer whether a victim touched certain addresses due to prefetcher behavior. Defensive teams now treat prefetchers as part of the attack surface, adding noise, partitioning caches, or letting software disable speculation on sensitive code sections.
6. Hybrid hardware-software prefetching
Modern systems blur the line between hardware logic and software hints. Compilers emit prefetch instructions for predictable loops. Operating systems annotate page tables with access frequency, letting hardware focus on hot regions. Database engines pre-issue asynchronous I/O to NVMe drives, overlapping storage access with CPU compute. The fastest designs orchestrate across layers: hardware handles nanosecond-scale speculation, software orchestrates microsecond-scale prefetch, and distributed caching tiers pre-stage data over milliseconds.
Academic work such as Feedback-Directed Prefetching marries the two. The hardware exposes telemetry—per-instruction accuracy, bandwidth usage—to the runtime. The runtime adjusts structures, enabling or disabling certain modes. When a dynamic language interpreter JIT-compiles a hot loop, it can emit a profile that instructs the prefetcher to track a new pattern immediately, bypassing the cold-start cost. This flow turns the prefetcher into a collaborative agent rather than a black box.
7. Machine-learned prefetchers
In the past five years, research prototypes replaced heuristic stride detectors with neural networks. Recurrent models consume streams of program counters and deltas, outputting predictions for future addresses. Attention mechanisms highlight which past accesses influence the future. Hardware budgets limit network size, but clever compression—systolic arrays, quantized weights—enables in-silicon inference. These models adapt quickly to new patterns, even irregular pointer chasing.
Shipping ML-based prefetchers requires solving data curation. Designers gather representative traces from benchmark suites and production workloads. They label each candidate prediction as useful or wasteful, train the network offline, and then graft it onto the microarchitecture. Online fine-tuning remains risky; mispredictions cost power. Some teams use speculative learning: they maintain a shadow model training in firmware, evaluate it periodically against safe thresholds, and only promote it once it beats the baseline.
8. Validation and verification
Verifying speculation is ten times harder than writing it. Designers must ensure prefetchers never violate coherence, respect memory ordering, and avoid deadlocks. Formal methods help: model checking the state machines, verifying that credit counters cannot underflow, and ensuring the request queues reach a quiescent state. Simulation validates performance under diverse workloads, but simulation speed is slow. Hybrid approaches use FPGA prototypes fed with recorded traces to approximate real-time behavior.
Security validation is newer but essential. Teams perform side-channel analysis, attempt rowhammer-style attacks, and measure cross-core interference. They instrument chips with performance counters measuring speculative bandwidth, verifying that new firmware respects global limits in multi-socket systems. Testing extends into manufacturing: wafer-level diagnostics enable or disable aggressive features depending on silicon quality, protecting yield.
9. Observability in production
Prefetchers once hid behind the hardware veil. Today, SREs demand observability. To support them, architects expose counters: total prefetch requests, useful hits, wasted lines, throttling events, bandwidth consumed per NUMA node, and cross-core interference metrics. Firmware accumulates histograms and surfaces them via model-specific registers or system firmware tables. On Linux, perf events allow user space to sample prefetcher state; cloud providers integrate the data into dashboards. When a regression surfaces, engineers correlate spikes in wasted speculation with workloads, adjust runtime hints, or push firmware updates that tweak thresholds.
10. Firmware updates and live experimentation
Speculative prefetchers increasingly run microcode that can be patched post-silicon. Vendors now roll out staged updates, enabling features for canary fleets before general availability. Live experimentation mirrors the software world: A/B testing multiple parameter sets, measuring tail latency and energy, then rolling back losers. Safe deployment demands guardrails: automatic throttle when waste exceeds thresholds, fail-open behavior if firmware hangs, and comprehensive logging for postmortem analysis. Firmware engineers partner with SREs to schedule maintenance windows and rehearse rollback drills.
11. Prefetching beyond CPUs
The concept is spreading. GPUs prefetch texture data for shaders; storage controllers pre-stage blocks from NVMe to DRAM; distributed caches prefetch query results based on predicted user behavior. Even databases implement software prefetch into buffer pools. Each domain reinterprets the basics: pattern detection, risk budgeting, and feedback control. Studying CPU prefetchers provides transferable lessons across the stack.
12. Designing for energy efficiency
Speculation consumes power. Each prefetched line toggles buses, burns DRAM energy, and warms caches. In mobile and edge devices, aggressive prefetching can halve battery life. That spurred energy-aware designs: gating predictors during low-power states, tying speculation levels to DVFS policies, and tracking the energy per useful prefetch. Some chips include an “eco” mode where speculation depth drops when thermal sensors report high temperatures. Smart prefetchers balance performance and energy dynamically, honoring user preferences or workload SLAs.
13. Prefetching meets security hardening
After Spectre, industry responded with selective speculation. Developers gained tools to fence vulnerable code, and hardware vendors added speculation barriers. Prefetchers likewise gained coarse and fine-grained controls. Code can disable speculation within sensitive kernels, and hypervisors enforce per-VM budgets. Upcoming architectures explore partitioned predictors keyed by security domains, preventing cross-tenant leakage. Research prototypes add noise to prefetch timing to thwart attackers while keeping aggregate benefits.
14. Measuring success: metrics that matter
Prefetch accuracy (hits / total) is the obvious metric, but not the only one. Bandwidth overhead, cache pollution, prefetch depth, queuing delay, and energy per useful prefetch all matter. Engineers create composite scores weighting each parameter according to customer priorities. For OLTP workloads, tail latency matters most; for HPC, throughput dominates. Observability dashboards highlight both positive and negative impacts, ensuring speculation never quietly regresses an unseen tenant.
15. Case study: from prototype to production
A large cloud provider recently shared a success story. Their baseline prefetcher tracked only simple strides. Analytics workloads wrote custom vectorized kernels that strided through columnar data, but mixed operations broke the detection logic. Engineers introduced a hybrid stride-correlation predictor, added telemetry, and built a software hint API. Over six months, they deployed the new firmware to 200,000 servers, measuring a 12% throughput gain on BigQuery-like workloads and a 6% reduction in p99 latency for OLTP services. They also learned the cost of complacency: a misconfigured rollout temporarily flooded a storage network, reminding everyone to keep throttles conservative.
16. Lessons for software engineers
Software developers cannot rewire silicon, but they can write prefetch-friendly code. Aligning data structures, making access patterns explicit, and using compiler intrinsics to express intent all help. Exposing profile data to hardware via standardized interfaces is an emerging frontier. In languages like Rust or Swift, libraries now include prefetch hints for iterators, bridging high-level programming with hardware capabilities. Education matters too: understanding how caches and prefetchers work lets teams design algorithms that sing on modern CPUs.
17. Research frontiers
The next wave explores cooperative learning between cores, application-specific predictors, and speculation-aware programming models. Imagine a runtime where functions declare their memory access intent, letting the system orchestrate prefetch across nodes, caches, and storage. Another frontier is simulation acceleration—making it feasible to experiment with new predictors without waiting months for silicon. Open-source simulator communities are converging on modular interfaces for predictor plugins, democratizing experimentation beyond chip vendors.
18. Checklist for practitioners
- Instrument your workloads: measure cache miss rates, bandwidth, and existing prefetch metrics before tuning.
- Understand the patterns: classify loops, pointer-chasing regions, and hot data structures.
- Start conservative: enable speculation gradually, with guardrails for waste.
- Collaborate across layers: hardware teams, compiler writers, runtime engineers, and SREs must share telemetry.
- Keep security in view: audit speculation for side channels and support disable switches.
- Iterate: treat prefetching as an ongoing program, not a one-off optimization.
19. Closing reflection
Speculative prefetching transforms impatience into performance. It rewards curiosity—the willingness to model future access patterns—and punishes complacency. As systems grow more complex, the line between hardware prediction and software intent blurs. Engineers who understand both sides can craft experiences where memory feels instantaneous. The midnight page becomes a story about prediction, risk, and the enduring thrill of bending time in a computer’s favor.
Appendix A: Following the numbers
Curiosity is easier to sustain when the numbers tell a story. Consider a processor with a 300-cycle DRAM latency, a workload generating one miss every 20 instructions, and a base IPC of 2. Without prefetching, the core stalls roughly 15 cycles per instruction. Introduce a prefetcher with 70% accuracy and a depth of two cache lines. When it succeeds, the miss vanishes; when it fails, it costs 30 cycles of additional bus contention. The expected stall per demand access becomes 0.7×0 + 0.3×30 = 9 cycles, cutting the penalty by 40%. Increase depth to four lines and you double bandwidth consumption; a queueing model shows demand latency creeping from 300 to 330 cycles due to congestion, reducing the net benefit. This arithmetic guides tuning: accuracy, depth, and throttles interact nonlinearly, and engineers rehearse notebook-style calculations before touching firmware.
Another example quantifies energy. Suppose each DRAM transaction burns 3.5 nJ. If a predictor issues 1 billion prefetches per second with 65% usefulness, that means 350 million wasteful requests costing 1.2 W. In a 95 W server CPU, that sounds negligible, but data centers run thousands of sockets. An extra 1.2 W across 250,000 machines is 300 kW, equating to roughly $250,000 per year in power and cooling. Numbers like these turn prefetch accuracy from an academic curiosity into an operational line item. Finance teams now sit in architecture reviews, asking how speculation budgets tie to real dollars.
Appendix B: Field notes and further reading
- “Energy-Efficient Data Prefetching” by Li et al. (ISCA 2011)—A foundational paper that quantified energy impacts and inspired eco-mode throttles.
- “Deep Learning for Prefetching” (MICRO 2019)—Introduced RNN-based predictors with compression-friendly architectures.
- “Feedback-Directed Prefetching” (ASPLOS 2014)—Bridged hardware counters with software adaptation, offering a blueprint for collaborative systems.
- “Speculation Side Channels” (IEEE S&P 2020)—Highlighted the security implications of aggressive speculation, including prefetchers.
- “Prefetching Goes Distributed” (USENIX ATC 2022)—Documented how a cloud provider unified CPU, GPU, and storage prefetching under a common telemetry service.
The literature remains vibrant. Workshops on memory systems now include tracks dedicated to speculative control theory, end-to-end observability, and privacy-preserving prediction. Practitioners who keep up with this expanding canon find themselves better equipped to defend architecture decisions, justify investments, and keep the midnight alerts at bay.
Appendix C: Self-assessment worksheet
Teams adopting speculative prefetching often ask where to start. We crafted a worksheet that turns abstract guidance into concrete actions. Work through it collaboratively across hardware, firmware, and software functions:
- Workload catalog: list top-five latency-sensitive workloads, their cache profiles (L1/L2 miss rates), and current performance pain points.
- Telemetry readiness: document which performance counters exist today, how often they are sampled, and who consumes the dashboards. Identify gaps—for example, lack of per-VM waste metrics.
- Risk appetite: articulate explicit budgets for bandwidth, energy, and potential cache pollution. Tie the budgets to business outcomes so trade-offs stay grounded.
- Experiment design: outline an A/B test plan with control and treatment cohorts, specifying rollout order, monitoring checks, and rollback criteria.
- Security checklist: inventory sensitive workloads (cryptography, multi-tenant isolation) that require speculation fences or partitioning ahead of rollout.
- Education plan: schedule knowledge-sharing sessions explaining prefetcher mechanics to software teams, with hands-on examples in profiling tools.
- Review cadence: decide how often telemetry will be reviewed and who owns summaries for leadership.
Completing the worksheet exposes assumptions and highlights cross-functional dependencies. It also provides an artifact for audits, demonstrating that the organization treats speculation as an engineered capability rather than a black box tweak.
Appendix D: Glossary of common terms
- Accuracy: The fraction of prefetched cache lines that become demand hits before eviction.
- Depth: How far ahead (in cache lines) the prefetcher looks relative to the current demand stream.
- Dynamic Voltage and Frequency Scaling (DVFS): Power management technique influencing how aggressively speculation should run under thermal constraints.
- Feedback-Directed Prefetching (FDP): A methodology where software adapts hardware prefetcher behavior based on observed telemetry.
- Lookahead: The ability of a predictor to recognize the shape of future memory accesses beyond immediate strides.
- Pollution: The negative effect of loading useless cache lines that evict useful data.
- Side channel: An indirect signal (timing, power) that can leak information; relevant when speculation observes secret-dependent access patterns.
- Throttle: Mechanism limiting the number of outstanding speculative requests to maintain quality of service.
Keep this glossary handy when onboarding new engineers so discussions stay crisp. Shared language accelerates collaboration and helps broader stakeholders grasp why speculative prefetching deserves disciplined stewardship.